Our journey to improved SecOps: Connect data sources and inject data to Azure Sentinel
22.07.2021
Blog
Hello again, this is the third part of our Azure Sentinel blog series.
Click here to read Part 1: Our journey to improved SecOps: How and why we chose Azure Sentinel
Click here to read Part 2: Our journey to improved SecOps: Instant benefits from Azure Sentinel
First – why we need data connectors
Data and log collection is the very first part of configuring every SIEM, it is the blood that keeps the SIEM running. A couple of key things to note regarding data collection:
-
You need to understand where each system stores the logs and how you will be able to collect them. With Azure Sentinel it is most likely that you will be able to collect the logs, but the collection method might vary
-
Logs collection must be configured on each system and in Azure Sentinel. If the system does not create logs Sentinel will not be able to collect them
-
Don’t collects logs which do not provide any value, as this will increase the log amount and costs in Sentinel. There are various filtering options
-
Log collection usually needs outbound HTTPS traffic, if systems are not connected to internet, then use log forwarder
Second – log collection options
The systems from which you will need to collect logs are different – cloud services, Windows and Linux servers, VPN devices, firewalls, proxies, etc. There are different methods for log collection, but it is almost certain that in one way or another it will be possible to inject logs in Sentinel. Here are the options for collecting the data:
-
Connect cloud services. This usually is the first and easiest way to inject data. For Microsoft cloud services, if you have required permissions, then just go to data connectors page in Azure Sentinel and with few clicks you have configured the connector. For other cloud services, this will be a bit harder
-
Install the Azure Sentinel agent (also called Log Analytics agent) on Linux and Windows Servers. This usually is the most straight forward option for servers, the agent uses HTTPS outbound traffic to send the logs. With this method you can collect data from event logs and log files
-
There are some vendors like Barracuda and F5 which have direct integration with Sentinel, meaning that you configure Sentinel integration directly from administrative console, check the vendor list here
-
For firewalls, proxies, network and VPN devices you will need to configure Syslog/CEF forwarder, this usually will be a separate server. Firewalls, proxies, network and VPN devices will send the logs to Syslog/CEF server, which will forward the logs to Azure Sentinel
-
The last option is to create a custom connector using REST API integrations. This will require more work to configure, but it works if other methods are not an option.
Third – value from data connectors
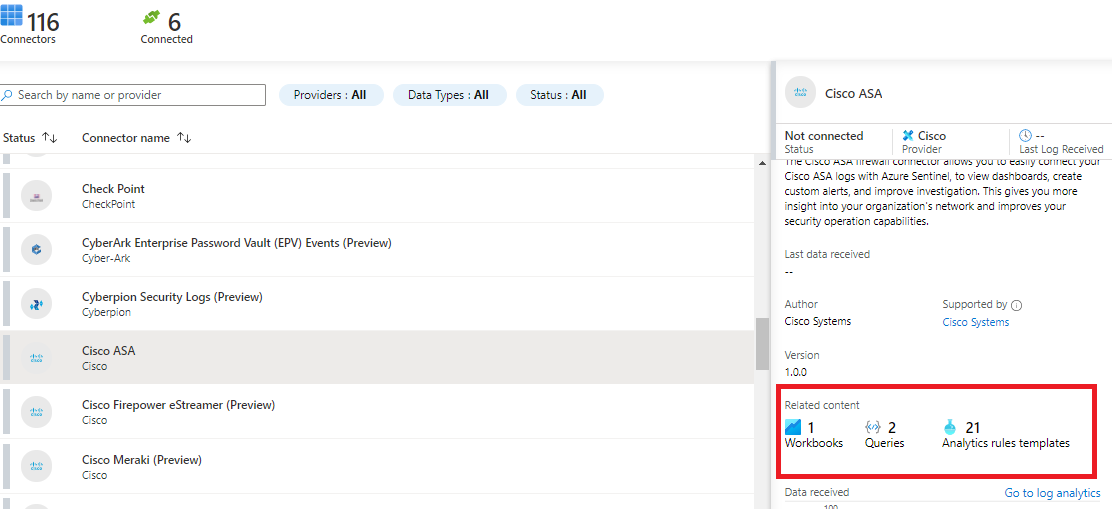
Once you connect data sources, the next step is to start analysing the data. For each configured data connector (at this moment there are 116 available data connectors) Microsoft already provides workbooks, queries and analytic rules, which usually are prepared by Microsoft and data connector’s vendor.
And if you are not familiar with Sentinel terminology, then:
-
Workbooks are dashboards with relevant information for that connector
-
Queries are KQL queries to be performed against Sentinel database. KQL is the query language used in Sentinel
-
Analytic rules are the ones which analyse logs, detect suspicious activities and alert you something bad is happening in your environment.
That’s it for today. Stay tuned for the next episode.
Previous Post
19.07.2021
News
Next Post
03.08.2021